LATEST CONFIRMED CASES OF COVID-19 IN SOUTH AFRICA (1 July 2022)
The National Institute for Communicable Diseases (NICD), a division of the National Health Laboratory Service, continues to provide laboratory-based surveillance to inform the public health response towards COVID-19 in South Africa.
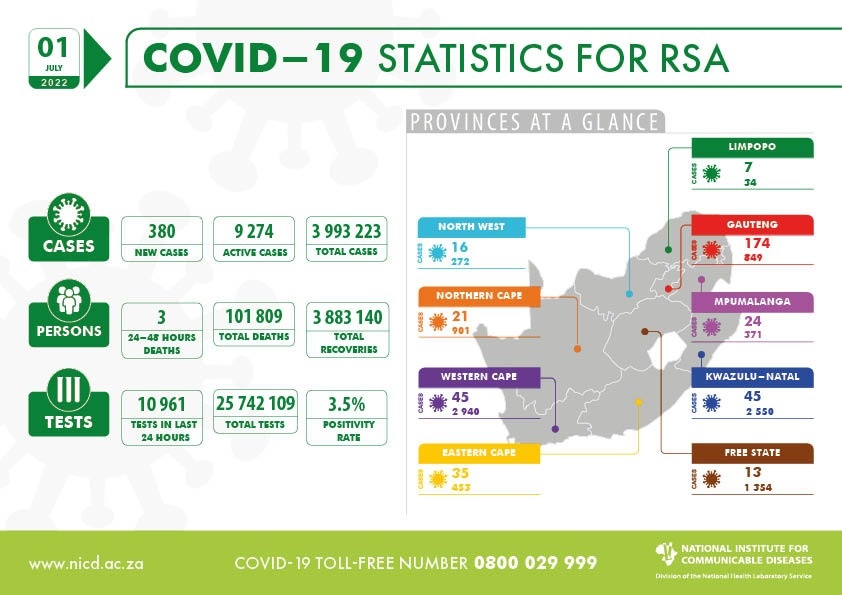
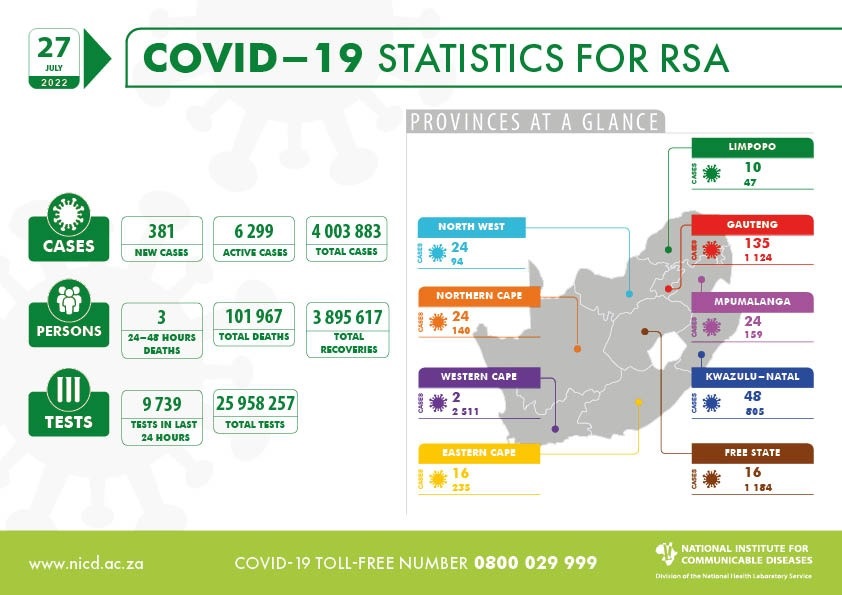
Today the institute reports 380 new COVID-19 cases that have been identified in South Africa, which brings the total number of laboratory-confirmed cases to 3 994 223. This increase represents a 3.5% positivity rate.
Today, the NDoH reports 16 deaths, and of these, 3 occurred in the past 24 – 48 hours. This brings the total fatalities to 101,809 to date.
25 742 109 tests have been conducted in both public and private sectors as per the table below.
| Sector | Total tested | New tested | ||
| Private | 14,013,318 | 54.4% | 6,064 | 55.3% |
| Public | 11,728,791 | 45.6% | 4,897 | 44.7% |
| Total | 25,742,109 | 100.0% | 10,961 | 100.0% |
PROVINCIAL BREAKDOWN
The majority of new cases today are from Gauteng (46%) followed by KwaZulu-Natal and Western Cape each accounting for 12% respectively. Eastern Cape accounted for 9%; Mpumalanga and Northern Cape each accounted for 6% respectively; North West accounted for 4%; Free State accounted for 3%; and Limpopo accounted for 2% of today’s cases respectively. The cumulative number of cases by province are shown in the table below:
| Province | Total cases for 30 June 2022 | Adjusted numbers after harmonisation | Updated total cases on 30 June 2022 | Incident infections for 01 July 2022 | Possible reinfections for 01 July 2022 | New cases on 01 July 2022 | Total cases for 01 July 2022 | Percentage total |
| Eastern Cape | 363,529 | 0 | 363,529 | 32 | 3 | 35 | 363,564 | 9.1 |
| Free State | 215,721 | 0 | 215,721 | 11 | 2 | 13 | 215,734 | 5.4 |
| Gauteng | 1,320,982 | 0 | 1,320,982 | 139 | 35 | 174 | 1,321,156 | 33.1 |
| KwaZulu-Natal | 715,652 | 0 | 715,652 | 43 | 2 | 45 | 715,697 | 17.9 |
| Limpopo | 159,429 | 0 | 159,429 | 6 | 1 | 7 | 159,436 | 4.0 |
| Mpumalanga | 201,665 | 0 | 201,665 | 22 | 2 | 24 | 201,689 | 5.0 |
| North West | 201,653 | 0 | 201,653 | 16 | 0 | 16 | 201,669 | 5.0 |
| Northern Cape | 115,122 | 0 | 115,122 | 19 | 2 | 21 | 115,143 | 2.9 |
| Western Cape | 700,090 | 0 | 700,090 | 39 | 6 | 45 | 700,135 | 17.5 |
| Total | 3,993,843 | 0 | 3,993,843 | 327 | 53 | 380 | 3,994,223 | 100.0 |
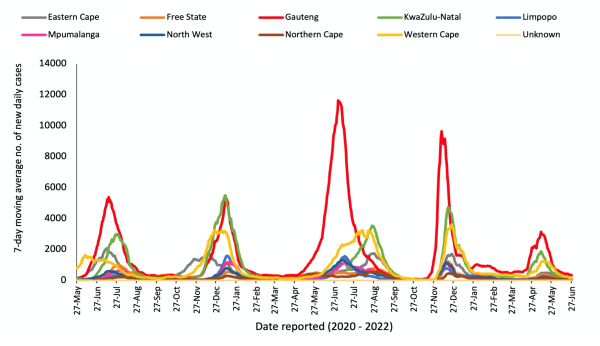
THE 7-DAY MOVING AVERAGE NUMBER OF NEW CASES BY PROVINCE
The proportion of positive new cases/total new tested today is (3.5%), and is lower than yesterday (3.6%). The 7-day average is (4,3%) today, and is lower than yesterday (4,8%)
For detailed information, visit the GIS Dashboard.
HOSPITAL ADMISSIONS
There has been an increase of 19 hospital admissions in the past 24 hours. The following table is a summary of reported COVID-19 admissions by sector.
| Sector | Facilities Reporting | Admissions to Date |
Died to Date | Currently Admitted |
| Private | 262 | 249,138 | 40,530 | 619 |
| Public | 407 | 289,810 | 63,388 | 769 |
| TOTAL | 669 | 538,948 | 103,918 | 1,388 |
VACCINE UPDATE
For updates on the national vaccine programme, click here. Thank you for your interest and remember that getting vaccinated for COVID-19 limits your risk of contracting and spreading the disease.
For more information on COVID-19, click here.


